
Forensic biology’s reportable outcome is DNA match. The likelihood ratio (LR) match statistic quantifies the association (LR>1) – or non-association (LR<1) – between evidence and reference. The LR summarizes DNA evidence strength in one useful number.
But an LR statistic can sometimes point the wrong way, supporting a match even when a person’s DNA isn’t in the evidence. How often does such match misclassification occur? This error rate is governed by the item’s match discrimination accuracy.
Match accuracy is an inherent property of DNA evidence data and its inferred genotypes. New science illuminates the error rates of incorrect LR scores for DNA match. Let’s illustrate DNA match accuracy in a recent exoneration case.
Commonwealth v. Wright
As previously reported in Forensic, Edward Wright was wrongfully convicted of the 1984 murder of his friend, Penny Anderson, in her Springfield, Massachusetts apartment. In Wright’s 2023 motion for a new trial, new DNA testing excluded Wright from key items connected to the murder.
A washcloth was collected from the victim’s bathtub. DNA testing showed a partial DNA mixture of at least two people. The laboratory’s probabilistic genotyping (PG) software found a small exclusionary LR of around ¼ for Wright. On a logarithmic (powers of ten) scale, the log(LR) was –0.60 ban, close to 0 information.
Subsequent Cybergenetics’ TrueAllele information-preserving genotyping (IPG) analysis of the same STR data produced a more exclusionary LR of one over 475 million. This log(LR) of –8.68 ban was 8 orders of magnitude more exclusionary.
Why was there such an LR disparity between TrueAllele’s IPG and the lab’s PG methods?
Three laboratory separations
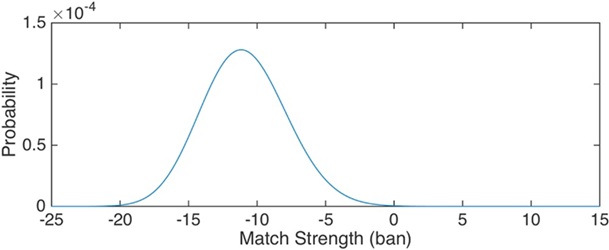
Figure 1. Noncontributor distribution of a genotype’s LR scores.
Separation is central to forensic DNA analysis. Before alleles are developed or genotypes compared, biological evidence must first be transformed into data files of allele events. Genotypes are later derived from quantitative amounts of detected alleles.
A forensic biology lab performs three key DNA separations. First, they physically extract an item's DNA molecules from background materials. Second, they use polymerase chain reaction (PCR) to biochemically amplify DNA from just one millionth of the human genome, separating STR identification alleles.
Third, their electrophoretic DNA sequencer separates amplified alleles by fragment size. Fluorescent detection produces quantitative allele data, packaged as computer files for downstream genotyping analysis.
The fourth separation: contributor genotype
The fourth forensic DNA separation transforms allele data into genotypes, one for each evidence contributor. Simple data can produce a definite genetic profile. With complex data (degraded DNA or small amounts) genotypes have probability.
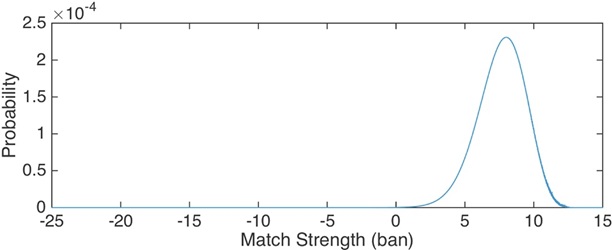
Figure 2. Contributor distribution of a genotype’s LR scores.
Genotype separation
splits complex DNA mixture data into simpler genotype variables. Information-preserving methods like TrueAllele IPG
separate a mixture of people into corresponding single-contributor genotypes. Representing genotype possibilities with accurate probability preserves DNA identification information.
Comparing a (probabilistic) separated evidence genotype with a reference genotype, relative to all people, yields an LR match score. The score tells us how strongly the reference person contributed their DNA (or not) to the evidence. The LR logarithm measures identification information.
Genotype match distribution curves
Suppose we could compare an evidence genotype with everyone on Earth. Or, even better, with all trillion-trillion multi-locus reference genotype possibilities. And then calculate each comparison’s LR match statistic. How often do the different LR values occur? That depends on reference genotype frequency.
The world’s human population is almost entirely comprised of people who didn’t contribute their DNA to a particular evidence item. Let’s assign more weight to the more common human genotypes. And then extend this population frequency weighting to all possible genotypes. Figure 1 shows the resulting “non-contributor” probability distribution of LR match scores. The figure’s logarithmic x-axis scale spans many orders of magnitude.
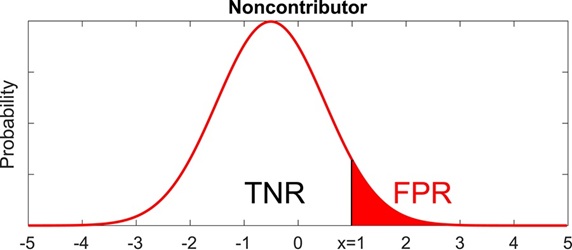
Figure 3. False Positive Rate (FPR) is the red right tail region under the Noncontributor distribution curve.
Now let’s change the genotype reference weighting. The
evidence genotype has probabilities that tell us which references are more likely to represent contributors to the DNA evidence. We’ll weight the more likely ones more strongly. Figure 2 shows the resulting “contributor” distribution of LR match scores, again on a log scale x-axis.
The above figures are from my 2018 Heliyon paper. The article shows how to construct complete high-resolution LR probability distributions in a hundredth of a second.
Match statistic error rates
Scientists use an evidence genotype’s LR distributions to calculate error rates. The following figures are from our recent 2026 Heliyon paper.
Suppose a suspect’s match statistic has a positive inclusionary log(LR) value. Then the false positive error rate (FPR) is the chance that comparison with someone whose DNA is not in the evidence will produce an LR the same or more than the suspect’s positive value. This FPR probability is the area under the Noncontributor distribution curve to the right of the suspect’s LR value, shown in red in Figure 3.
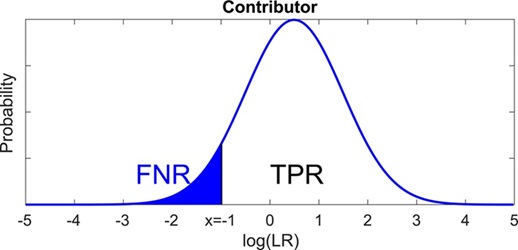
Figure 4. False Negative Rate (FNR) is the blue left tail region under the Contributor distribution curve.
Now suppose instead that a suspect’s match statistic has a negative exclusionary log(LR) value. Then the
false negative error rate (FNR) is the chance that comparison with a person whose DNA is truly in the evidence will produce an LR equal to or less than the suspect’s negative value. This FNR probability is the area under the Contributor distribution curve to the left of the suspect’s LR value, shown in blue in Figure 4.
In the Wright case, we used this error rate approach to calculate an FNR (blue left tail probability) of one in 1.88 trillion for Wright’s exclusionary LR of one over 475 million. TrueAllele’s Distribution window determined the error rate instantly.
Error rate is one of Daubert’s four reliability prongs for court admissibility of scientific evidence. The FPR gives the chance of a false DNA inclusion, where a false inclusionary LR could help convict an innocent person. The FNR is the chance of a false exclusion, where a false exclusionary LR could help free a true perpetrator. These error rates are easily and instantly determined from genotype LR distributions.
The fifth separation: match accuracy
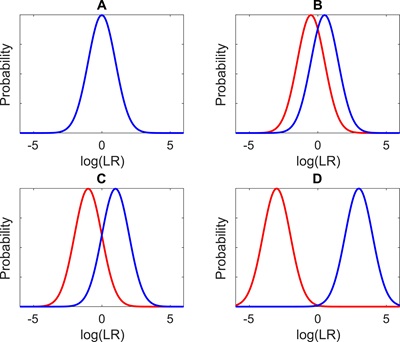
Figure 5. Noncontributor (red) and Contributor (blue) distribution curve overlap, progressing from complete overlap (A) to no overlap (D).
An evidence genotype’s Contributor LR probability distribution represents a state of the world where someone contributed their DNA to the biological evidence. The Noncontributor distribution is the alternative reality, expressed through LR, for people who didn’t contribute their DNA.
If the two distribution curves were identical, the LR match statistic wouldn’t distinguish contributors from noncontributors (Figure 5A). With some curve separation, the LR becomes less ambiguous and more discriminating (Figure 5B).
More informative DNA evidence leads to more informative genotypes that better separate the left and right LR curves, yielding greater match discrimination ability (Figure 5C). With totally informative evidence there is complete curve separation, and the LR match statistic becomes a perfect classifier (Figure 5D).
As introduced in this year’s Heliyon paper, we can combine the two LR distribution curves to calculate a genotype’s classification accuracy. Such “ROC” curve combination is widely used in fields like Artificial Intelligence and Medicine to assess the “AUC” accuracy of data analysis methods. The inherent LR match accuracy can be derived directly from the evidence genotype, before ever comparing with a suspect. (Note: ROC stands for “Receiver Operating Characteristic.” AUC means “Area Under the ROC Curve.”)
The fifth forensic DNA separation is match discrimination accuracy, based on the separation of an evidence genotype’s LR distribution curves. This match accuracy measures how well the genotype’s LR match statistic discriminates between contributors and noncontributors. More curve overlap leads to more match misclassification error.
The Wright answer
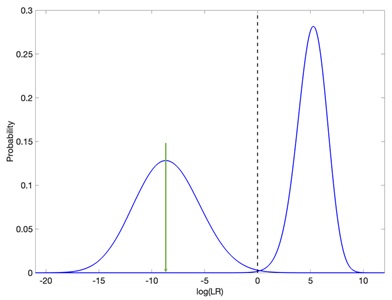
Figure 6. Well-separated TrueAllele distributions (blue curves) with a strong exclusionary LR (green arrow).
TrueAllele examined the lab’s two-person mixture data from the washcloth. IPG processing preserved the DNA data’s identification information. The computer used 230 STR data peaks (no thresholds), modeled every lab parameter and its variation at every locus, and considered all possible genotypes. The separated contributor evidence genotype recovered –8.68 ban of exclusionary log(LR) information (one over 475 million), with a very low false negative error rate.
Figure 6 shows the evidence genotype’s pair of distribution curves. TrueAllele curve separation is complete, with essentially no overlap between noncontributor (left) and contributor (right) LR values. Based on this separation, the calculated match classification accuracy is 100.00%. We see the exclusionary –8.68 log(LR) value (green arrow) centered in the left Noncontributor LR distribution, far from right axis Contributor LR values.
The DNA lab’s analysis preserved less DNA information. Their PG software used 16 data peaks (at 100 RFU threshold), modeled fewer parameters, and (relying on observed peaks) considered fewer genotypes. The weaker log(LR) exclusionary result was –0.60 ban, or 8 orders of magnitude less than TrueAllele’s recovered information.
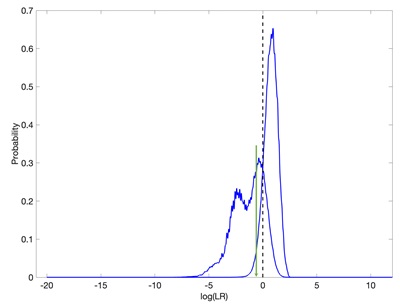
Figure 7. Poorly separated lab PG distributions (blue curves) with a weak exclusionary LR (green arrow).
Figure 7 explains the match statistic disparity. Less informative PG curves and LR values move inward, closer to zero information. The lab’s distribution curves are close together. The curves overlap, reducing match classification accuracy to 92.45%. The small exclusionary log(LR) of –0.60 (green arrow) falls in the overlap region. This LR region cannot distinguish between Noncontributor and Contributor.
A 92.5% match classification accuracy means that 7.5% of the time (1 in 14) an LR comparison will point in the wrong direction. A positive log(LR) can erroneously misclassify someone whose DNA isn’t in the evidence as a contributor. Or a negative match statistic can misclassify someone who really did leave their DNA as a noncontributor. A jury plus two lawyers make 14 people. How reliable is biological evidence when LR comparisons misclassify a defendant 1 in 14 times?
In 2025, after 40 years in prison, Edward Wright’s murder conviction was overturned and he was released. The District Attorney did not seek a new trial.